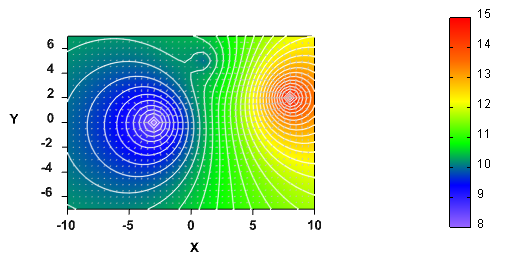
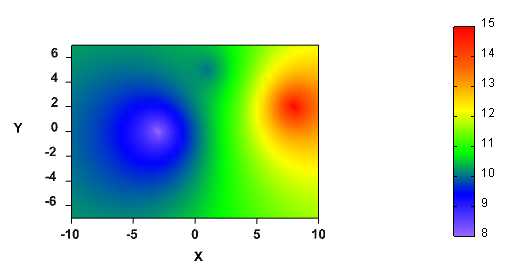
This example illustrates how to create color map, contour plot and vector plot by the usage of 3D surface data. You can find the data in the file setuppath\ samples\data\regular.txt, here setuppath is the setup path of Visual Data Pro in your computer, for example, c:\program files\Visual Data 1. Click 2. Click Import Data ... item from File menu to import data from the file setuppath\ samples\data\regular.txt. The size of the data is 41*29. You can see them in Data Edittor.
3. Click
Click OK button to create the color map.
4. Click
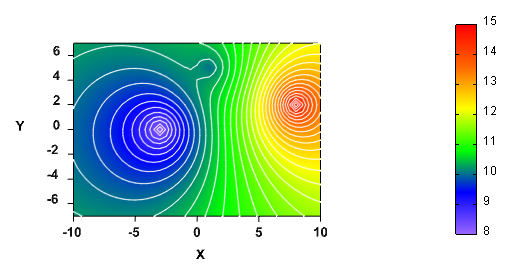
Click OK button to add the contour plot.
5. Click
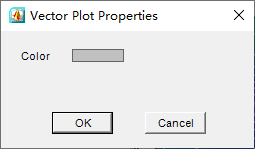
Click OK button to add the vector plot.
|
||
Download Visual Data today and start creating stunning scientific visualizations for your research and analysis.

 button.
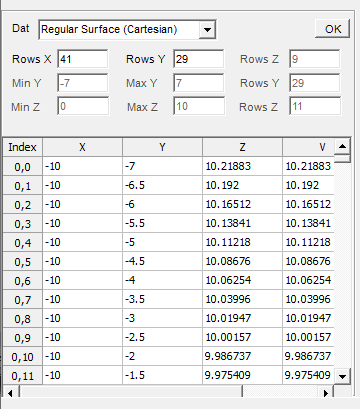
 button in Standard toolbar to open Color Map Properties dialogbox. Set colors of the graph.
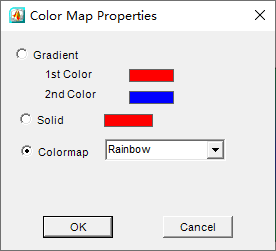
 button in Standard toolbar to open Contour Plot Properties dialogbox. Input 30 in Levels textbox. Set color of contour lines to be grey in Lines tab.
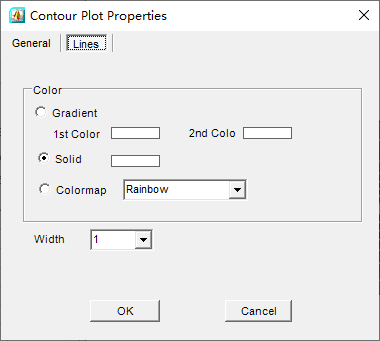
 button in Standard toolbar to open Vector Plot Properties dialogbox. Set color of the vectors.